Crypto breakout drives massive short-covering, looks important technically
Key Takeaways
- Many Cryptocurrencies look to have made significant technical breakouts starting early Friday morning with BTCUSD, SOLUSD, ETHUSD, LTCUSD, and XRPUSD all jumping 8% +
- Technically this looks to be a positive given prices having eclipsed weekly highs as well as one-month downtrends. This gives rise to the possibility that BTCUSD might be kicking off its traditionally bullish 4Q seasonal rally
- Momentum remains positive on weekly charts and has turned quickly back to positive territory also on daily charts as a result of Friday’s surge
Bitcoin finally resolved its 10-day sideways range by exceeding the downtrend which had been in place since early September. Note, trends had turned negative a month ago technically, but after a visible three-wave decline into late September, Friday’s move is a big positive in helping to resolve this consolidation. First upside target lies at September highs at 52,956, then 64,895
Key Technical positives:
Daily and weekly momentum now positive per MACD (Moving Average Convergence Divergence)
DeMark counter-trend indicators triggered TD Sequential “13 Countdown” signals on 60 min and 120 minute charts that often can be important in signaling trend change in late September
...Reports you haven't read
BITCOIN (BTC -1.54% ) “CRYPTO-WINTER” LOOKS TO BE OVER. A BULLISH 2024 LOOKS LIKELY TECHNICALLY FOLLOWING A 1Q CONSOLIDATION. Bitcoin looks to be giving off strong signals that the crypto-winter that has kept most coins in bear markets over the last couple years has finally run its course. The act of having taken the lead ahead of many cryptocurrencies in finally surpassing the 50% retracement area of its entire decline from 2021...
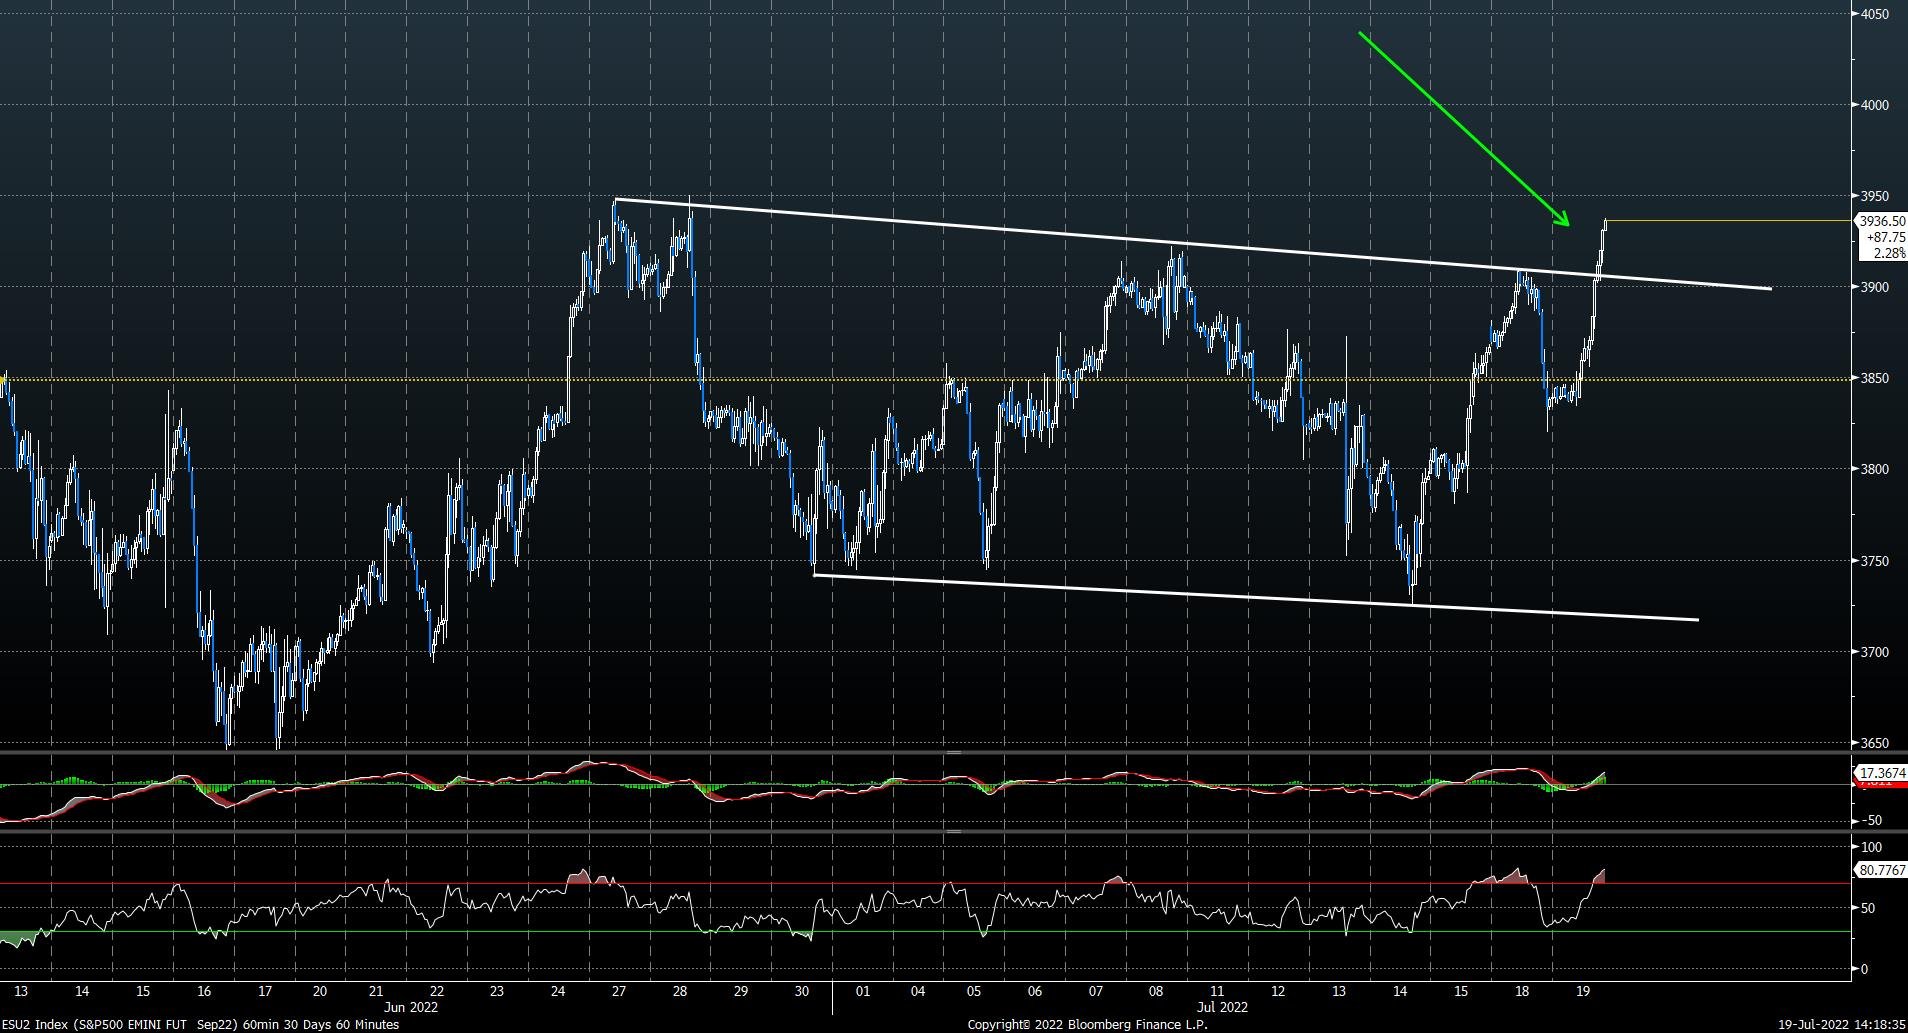
Tuesday produced nearly a textbook breakout which not only exceeded late June and early July highs in SPX, but also successfully exceeded 3-4 month downtrends for SPX and DJIA. Seven of the 11 S&P Select SPDR ETF’s were higher by more than 3%, and volume was nearly 10/1 bullish on NYSE and NASDAQ, producing a “90% Up day” in volume. Hourly charts show this breakout above the two former peaks...
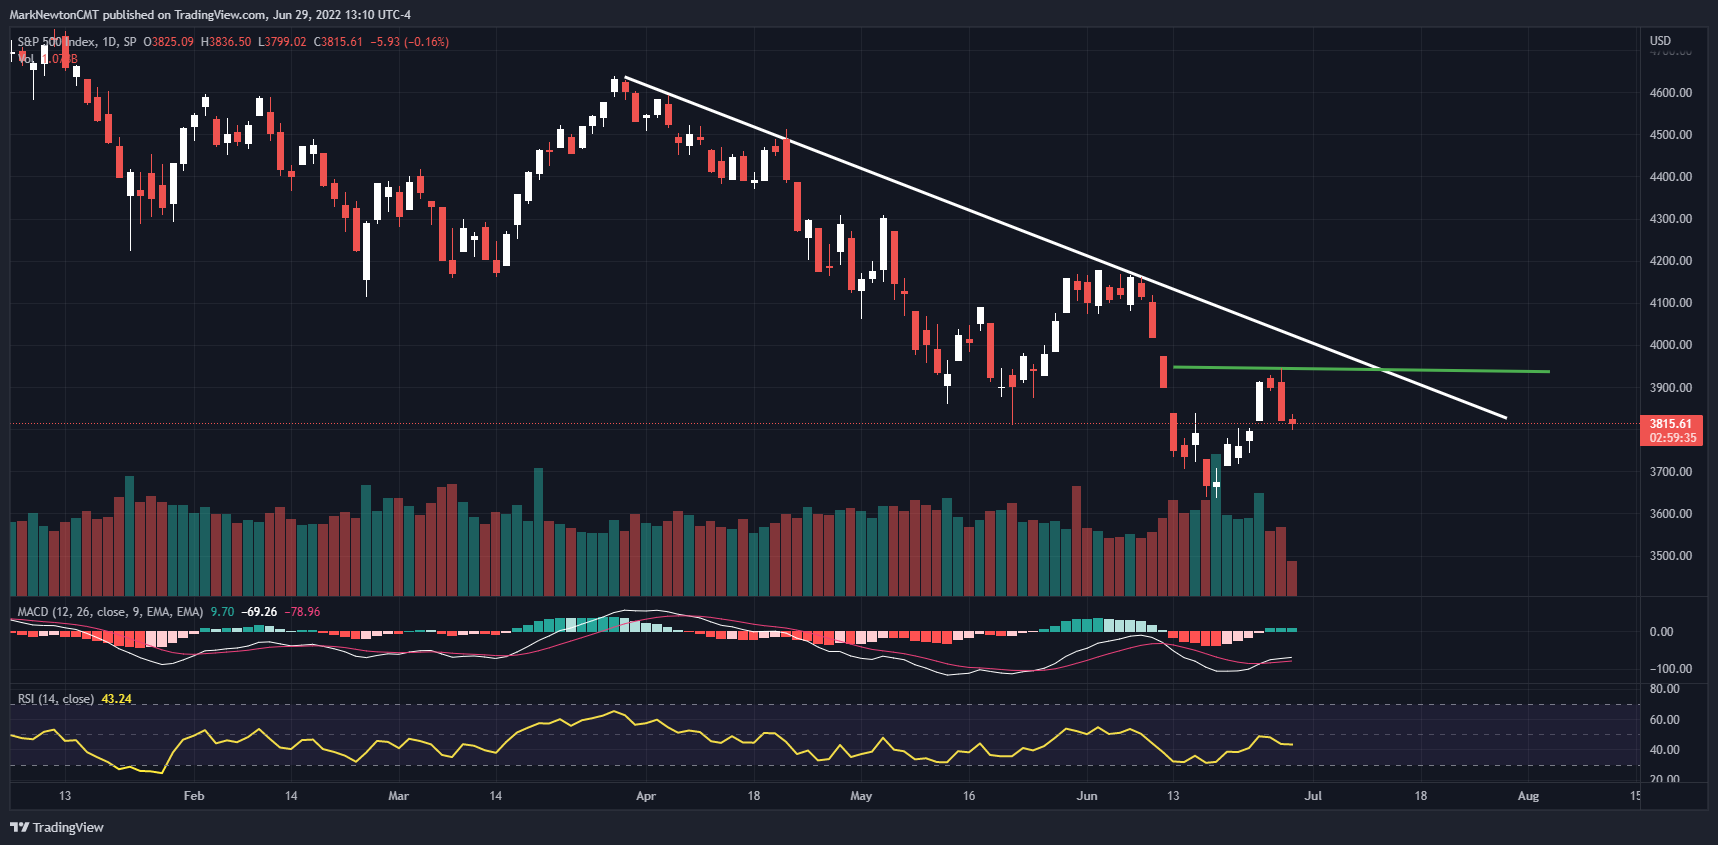
The SPX showed just minor downside follow-through after Tuesday’s reversal but might not immediately weaken down to prior lows ahead of the US July 4th holiday. As mentioned, prices reversed on cue Tuesday due to a combination of Elliott-wave analysis with Gann analysis which provided price and time targets based on the prior June 16th bottom. I expect that the next couple days might show prices attempting to stabilize and...
Cryptocurrency rally looks to have temporarily stalled out after a sharp three-week rally. Ethereum has stalled out in its relative performance vs Bitcoin, and for now, Bitcoin is an outperformer over Ethereum and should be favored. Weekly momentum remains negative and Cycle composites start to turn lower in early March into April/May, so given low retail interest and not many inflows, this could limit the larger rally continuing to all-time highs...
Articles Read 1/1
🎁 Unlock 1 extra article by joining our Community!
You’ve reached your limit of 1 free monthly articles. Please enter your email to unlock 1 more articles.
Already have an account? Sign In 317d40-6feafd-b795a9-db6ccd-fc0f0f
Already have an account? Sign In 317d40-6feafd-b795a9-db6ccd-fc0f0f


